The Attribution Crisis of 2026: Why Your Pixels Are Under-Reporting by 30%+
If you're looking at your sales dashboard and your Meta/TikTok ad managers and the numbers don't add up, you aren't crazy. You're witnessing the Attribution Crisis of 2026.
For years, we've relied on "the pixel"—a small piece of code designed to follow users from a social click to a checkout page. But in 2026, that pixel is effectively broken. iOS privacy restrictions, cross-device behavior, and browser-level tracking prevention have created a massive blind spot in your data.
Most brands are currently under-reporting their marketing success by at least 30%—and for many, the gap is closer to 50%. Here's why it's happening and how to fix it.
The Real Culprits Behind Your Missing Data
Let's clear up a common misconception: the "death of the cookie" everyone predicted hasn't happened. Google reversed its third-party cookie deprecation plans in July 2024, and cookies remain active by default in Chrome, which holds roughly 65% of global browser market share.
So why is your pixel still failing? Three major forces are at play:
1. iOS App Tracking Transparency (ATT)
Apple's ATT framework, introduced with iOS 14.5, requires apps to ask permission before tracking users across other apps and websites. The opt-in rate has stabilized at roughly 35% globally—meaning approximately two-thirds of iOS users are invisible to your pixel.
The immediate impact was severe: advertisers saw 38% declines in ROAS and nearly 35% drops in reported revenue in the months following rollout. Meta's response was to shorten their default attribution window from 28-day click to 7-day click, which means conversions that happen after a week simply don't get counted.
2. Browser-Level Tracking Prevention
While Chrome kept cookies, Safari and Firefox didn't wait around:
Safari (roughly 18% market share) has blocked third-party cookies since 2017 and now expires JavaScript-set first-party cookies after just 7 days
Firefox blocks tracking cookies by default and added significant anti-fingerprinting protections in late 2025
TikTok's pixel doesn't work at all on Safari or Firefox browsers
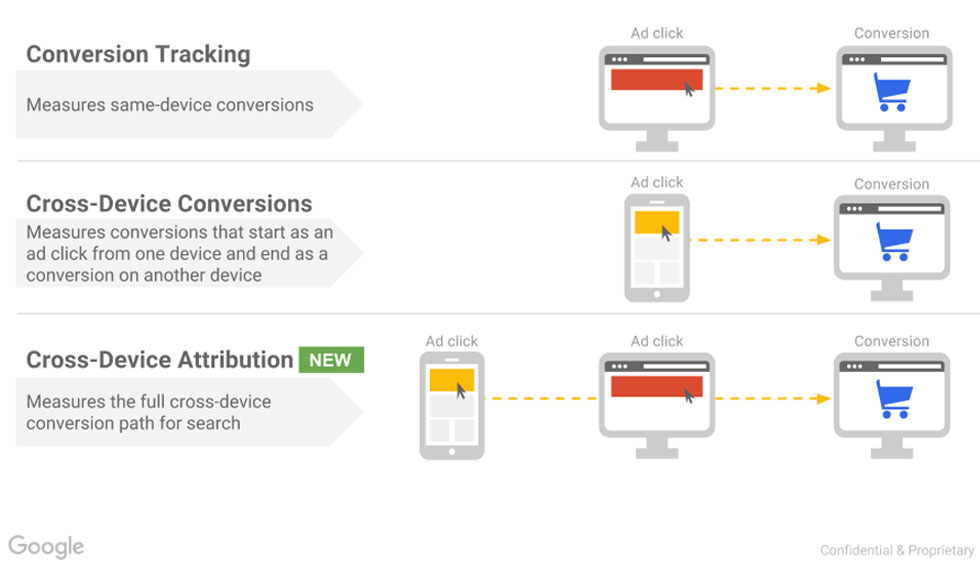
3. Cross-Device Behavior
This is the silent killer of attribution accuracy. Studies show 41-65% of all online purchases involve multiple devices. Your customer sees your ad on their phone during lunch, but they complete the purchase on their laptop that evening. To your pixel, these look like two completely unrelated people.
Meta's own transparency reports indicate that over 50% of browser-side conversions go untracked when using pixel-only tracking. One documented case study showed a 57% gap between actual sales and Facebook's reported conversions.
The "Considered Purchase" Timeline
The biggest mistake brands make is assuming the customer journey is linear: Click → Buy. In reality, customers in 2026 are researchers.
Imagine this: A user sees your fashion brand or new kitchen gadget on TikTok while they're on the bus. They like it, but they don't buy immediately—purchasing on a mobile browser while commuting is high-friction. Instead, they close the app.
Later that evening, once they're home, they open their laptop, search for your brand name on Google, and complete the purchase.
To your pixel, that social view is "lost." To your sales dashboard, that sale is labeled as "Direct" or "Organic Search." The influencer or ad that actually sparked the interest gets zero credit.
The data backs this up: fashion retail sees 78% of visits on mobile but only 47% of purchases. Desktop converts at 3.8-4.3% while mobile converts at just 1.2-2.2%—roughly half the rate. For items over $100, customers almost always research on mobile and switch to desktop to buy.
This is the "Considered Purchase" gap, and it's where your missing 30%+ of attributed revenue is hiding.
How to Calculate Your Attribution Gap
You can't fix what you can't measure. Every founder should know their Attribution Gap—the difference between the money in your bank and the money your dashboards claim your marketing generated.
The Formula:
Attribution Gap=Actual Revenue−Platform-Reported RevenueActual Revenue×100\text{Attribution Gap} = \frac{\text{Actual Revenue} - \text{Platform-Reported Revenue}}{\text{Actual Revenue}} \times 100Attribution Gap=Actual RevenueActual Revenue−Platform-Reported Revenue×100
Where:
Actual Revenue:
Every dollar that hit your store (from your payment processor, sales dashboard, or accounting system)
Platform-Reported Revenue:
The sum of conversions claimed by Meta, TikTok, Google Ads, and your affiliate links
How to interpret your number:
Gap | What It Means |
Under 15% | Your tracking is relatively healthy—minor discrepancies are normal |
15-30% | Significant signal loss; you're likely undervaluing top-of-funnel channels |
30-50% | Severe attribution failure; major budget decisions based on this data are risky |
Over 50% | Your pixel infrastructure needs immediate attention |
If your gap exceeds 20%, you're likely making decisions—like cutting ad spend or dropping influencers—based on incomplete data that doesn't reflect your real marketing impact.
The Fix: A Multi-Layered Measurement Strategy
The era of "set up a pixel and forget it" is over. Here's what actually works in 2026:
1. Implement Server-Side Tracking (Non-Negotiable)
The single most impactful change you can make is adding server-side tracking alongside your browser pixel. This sends conversion data directly from your server to the ad platforms, bypassing browser restrictions entirely.
Meta Conversions API (CAPI):
Tracks 2.5-3x more events than pixel alone and delivers 15-20% performance improvement
TikTok Events API:
Produces a 13% average increase in event capture and up to 60% more conversions tracked
Google Enhanced Conversions:
Improves conversion measurement by matching hashed first-party data
If you're on Shopify, WooCommerce, or most major ecommerce platforms, there are native integrations and apps that make this relatively straightforward. If you're on a custom build, you'll need developer resources, but it's worth the investment.
2. Use Post-Purchase Surveys
Sometimes the simplest solution is the most effective: just ask customers how they found you.
Add a "How did you hear about us?" question to your checkout or confirmation page. The options should include:
TikTok
Instagram/Facebook
YouTube
Google Search
Friend/Word of Mouth
Podcast (with space to specify which one)
Influencer (with space to specify who)
Other
This won't capture everyone, but it provides ground-truth data that no pixel can dispute. When 40% of your survey respondents say "TikTok" but your pixel attributes only 15% of revenue to that platform, you've identified exactly where your attribution gap lives.
3. Correlation Analysis (The "Pulse" Method)
Since pixels can no longer reliably follow individual users, you can shift to analyzing patterns in aggregate data.
How it works:
Export your sales data
for a specific period. You need two columns: timestamp and revenue amount.
Map sales against marketing activity.
When did your influencer post? When did your ad go live? When did you send that email?
Look for correlated spikes.
If an influencer posts at 2:00 PM and your "Direct" sales surge at 3:30 PM, that's signal—even without a tracked click.
Important note on timing: Don't expect the correlation to show up in 1-2 hours. Platform attribution windows exist for a reason:
Platform | Standard Click Window | Standard View Window |
Meta | 7 days | 1 day |
TikTok | 7 days | 1 day |
Google Ads | 30 days | N/A |
For considered purchases, the lag between exposure and conversion often extends 24-72 hours or longer. Look for patterns across that full window, not just immediate spikes.
4. Media Mix Modeling (MMM)
For brands spending $50K+ monthly on marketing, Media Mix Modeling has become essential. MMM uses statistical analysis to determine how much each channel contributes to overall sales—independent of pixel tracking.
53% of US marketers now use MMM, with 34% prioritizing it over all other measurement solutions. Options range from enterprise platforms (Measured, Rockerbox, Northbeam) to open-source tools (Meta's Robyn, Google's Meridian) that make this accessible to smaller brands.
MMM won't tell you which specific ad drove which specific sale, but it will tell you whether TikTok is actually driving 25% of your revenue even though your pixel says 8%.
5. Incrementality Testing
This is the gold standard for proving causation, not just correlation. The concept is simple: show ads to one group, withhold them from a similar group, and measure the difference in conversions.
Google has lowered minimum spend requirements from ~$100,000 to just $5,000 per experiment, making this accessible to more brands. Meta and TikTok offer similar lift study tools.
Run incrementality tests quarterly on your major channels. The results often surprise people—channels that look weak in last-click attribution frequently show strong incremental lift, while some "high-performing" channels are revealed to be capturing conversions that would have happened anyway.
Attribution Tools Worth Considering
The attribution software landscape has matured significantly. Here are the established players:
For DTC/Ecommerce:
Triple Whale
— Popular among Shopify brands; combines pixel tracking with post-purchase surveys and MMM
Northbeam
— Strong on multi-touch attribution with machine learning models
Rockerbox
— Focuses on marketing mix modeling and incrementality
For Mobile Apps:
AppsFlyer
— Industry standard for mobile attribution
Adjust
— Strong privacy-first attribution with SKAdNetwork support
Branch
— Specializes in deep linking and cross-platform attribution
For Influencer-Specific Attribution:
Grin, CreatorIQ, impact.com
— Track influencer campaigns with unique links, codes, and post-engagement correlation
These platforms aggregate data from multiple sources, apply statistical models to fill attribution gaps, and give you a more complete picture than any single pixel can provide.
The 2026 Reality
The brands that win this year won't be the ones with the best pixels—they'll be the ones with the best measurement infrastructure.
Here's your action checklist:
Calculate your attribution gap today.
If it's over 20%, you have work to do.
Implement server-side tracking this month.
Meta CAPI and TikTok Events API should be live within 30 days.
Add a post-purchase survey this week.
It takes 15 minutes and immediately starts generating ground-truth data.
Stop making major budget decisions on pixel data alone.
Triangulate with surveys, correlation analysis, and, if possible, incrementality tests.
Accept that perfect attribution is gone.
The goal isn't to track every user—it's to make better decisions with imperfect but directionally accurate data.
Your customers are researching across devices, converting outside of trackable windows, and ignoring your carefully constructed UTM links. Your measurement strategy needs to meet them where they actually are—not where your pixel wishes they were.
The attribution landscape will continue to evolve. iOS 18 brought additional privacy features, regulators worldwide are tighthat tracking technologies, and consumer behaviour keeps fragmenting across more devices and platforms. The brands that build robust, multi-source measurement systems now will have a significant competitive advantage as the ecosystem continues to shift.